Budget
The Budget section provides a high-level overview of your categorized income and expenses, grouped by month. It helps you monitor how closely you're following your financial plan over the year. You can switch between 1, 3, 6, or 12-month views, track performance by category, and easily spot over- or under-spending.
Use this section to fine-tune your monthly allocations, compare your plan against YTD actuals, review the moving average, and adjust future targets based on real-world trends.
Budget Views
Use the layout switcher to view your budget three ways. Your choice is remembered for each budget.
- Table — the classic spreadsheet: category rows by month columns, plus summary columns. Best on wider windows for comparing months side by side.
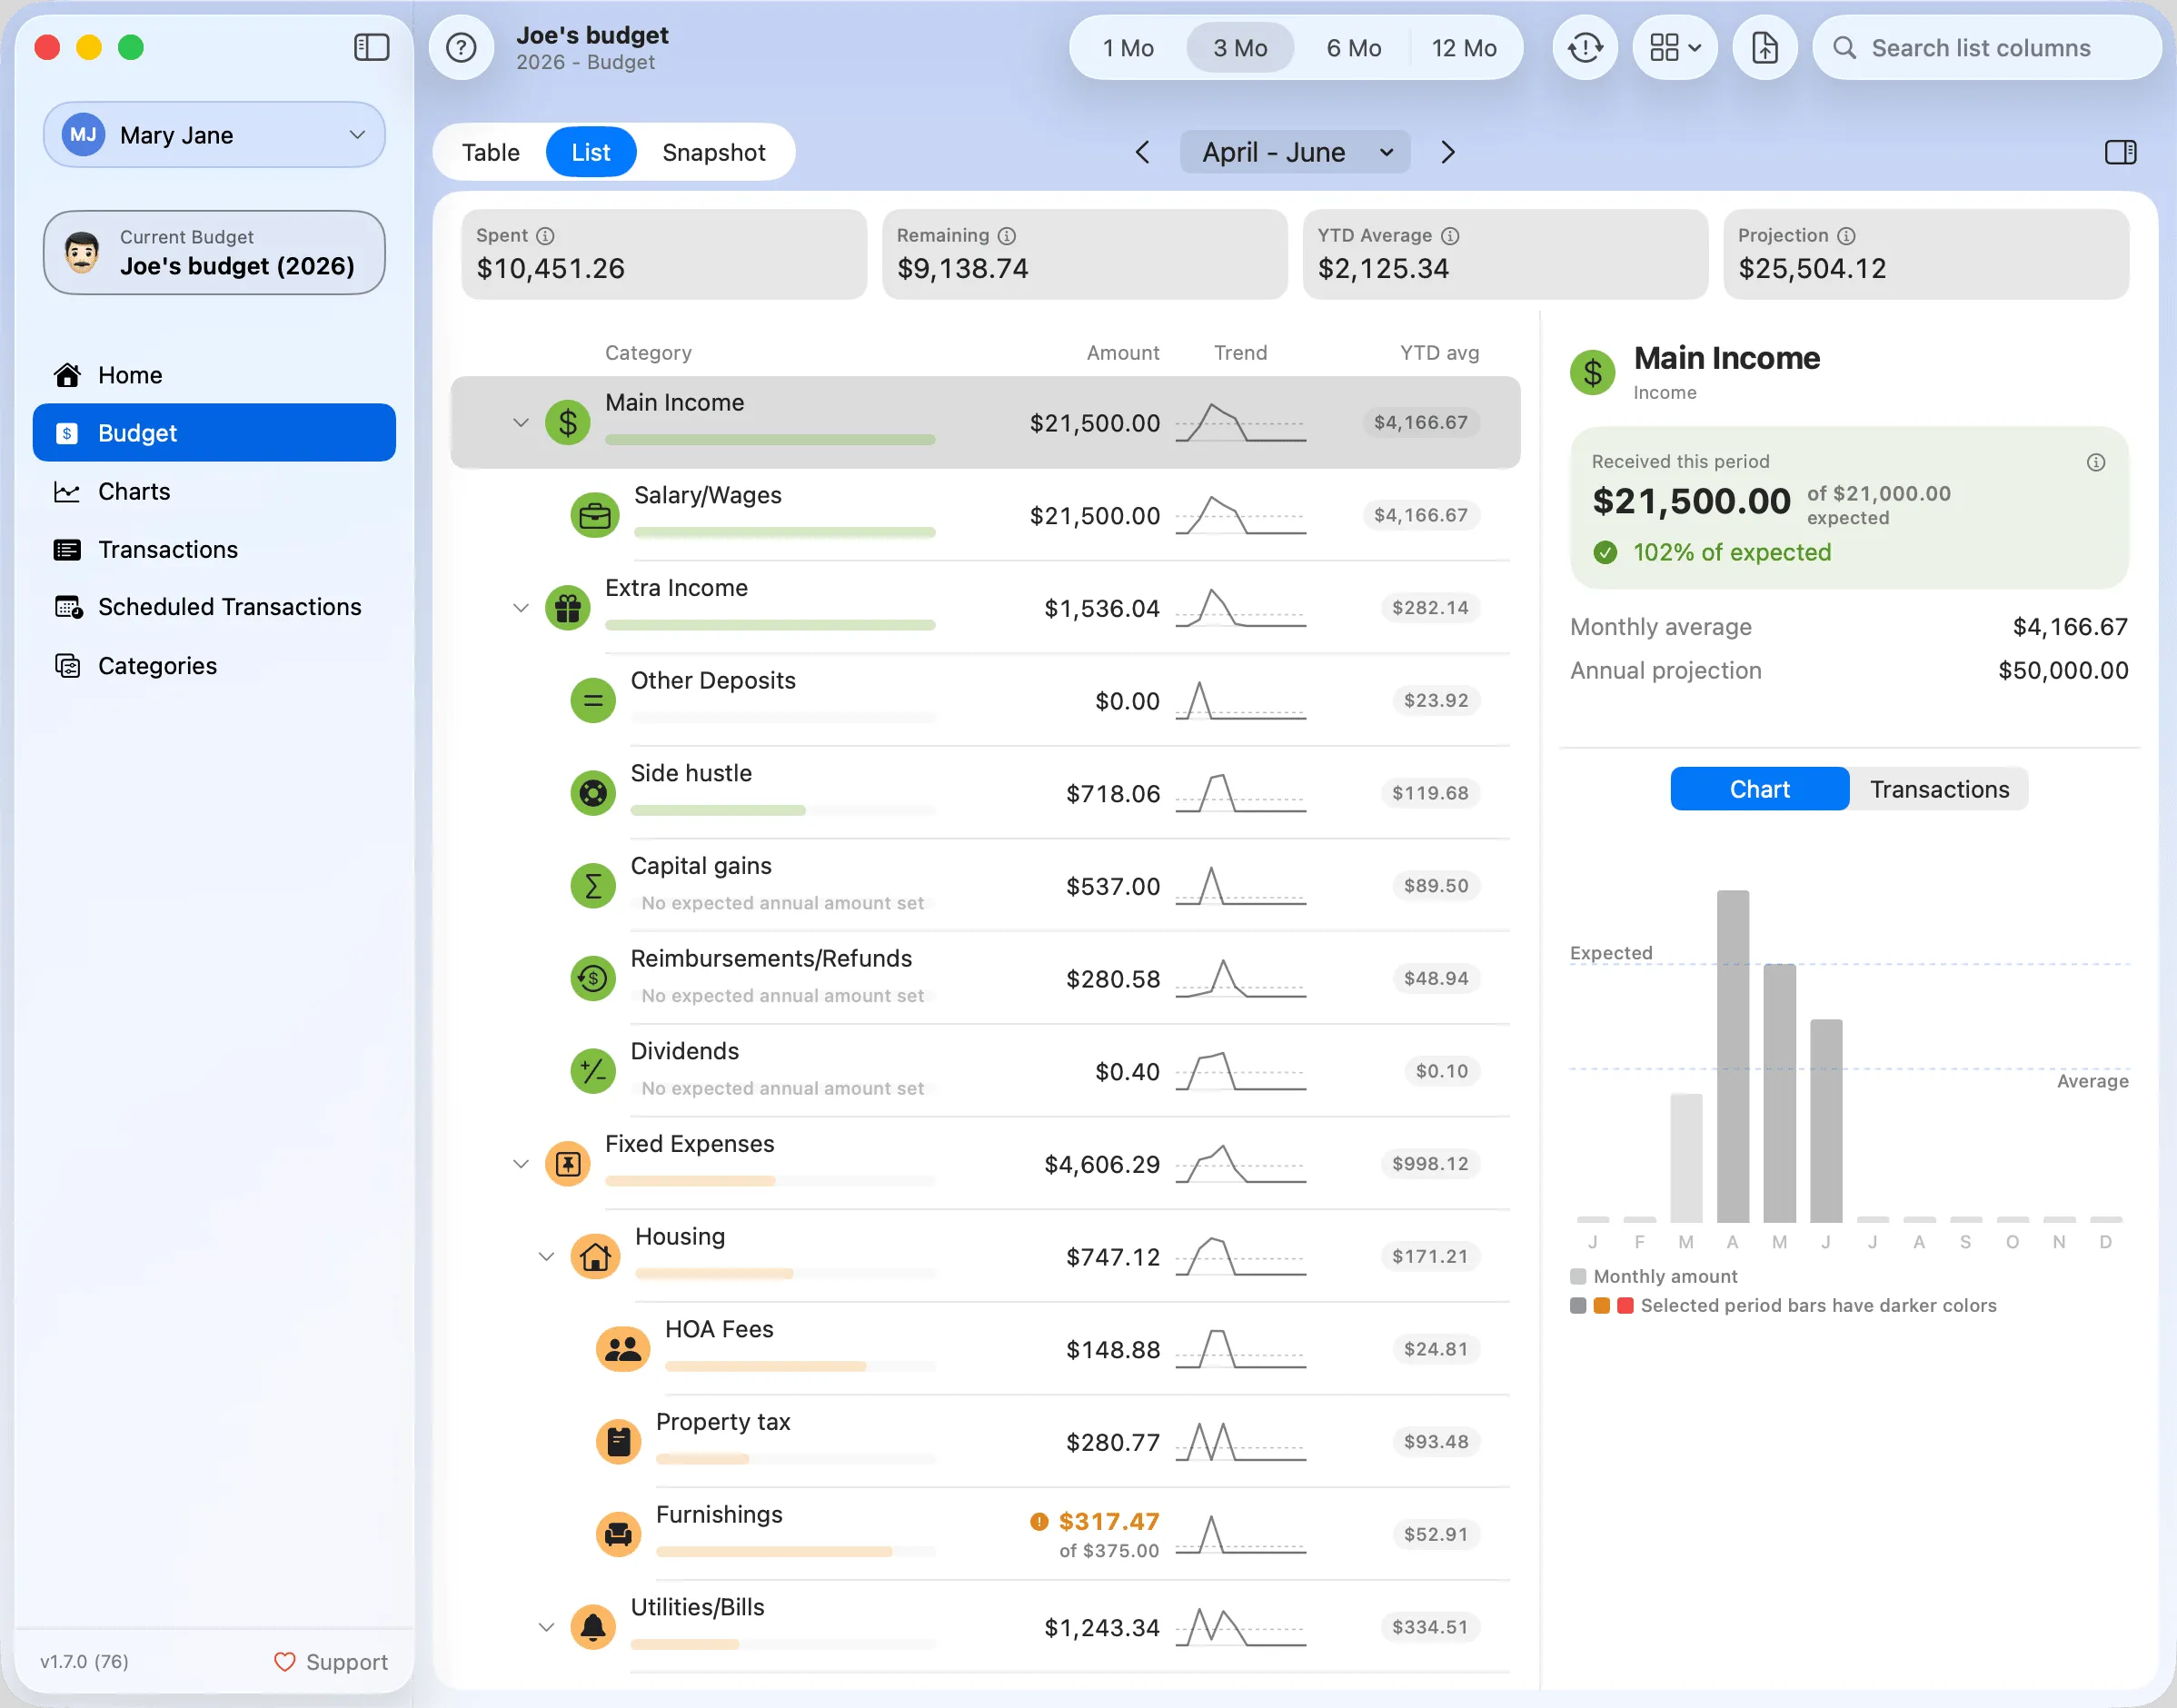
- List — a compact, hierarchical view of your categories, each with a spend-vs-expected bar, a 12-month trend sparkline, and a YTD average. Select a category to open a detail panel with its chart and transactions tabs. Switch to the transactions tab to see all transactions that contribute to that category's amount. Great for narrower windows or focusing on one branch at a time.
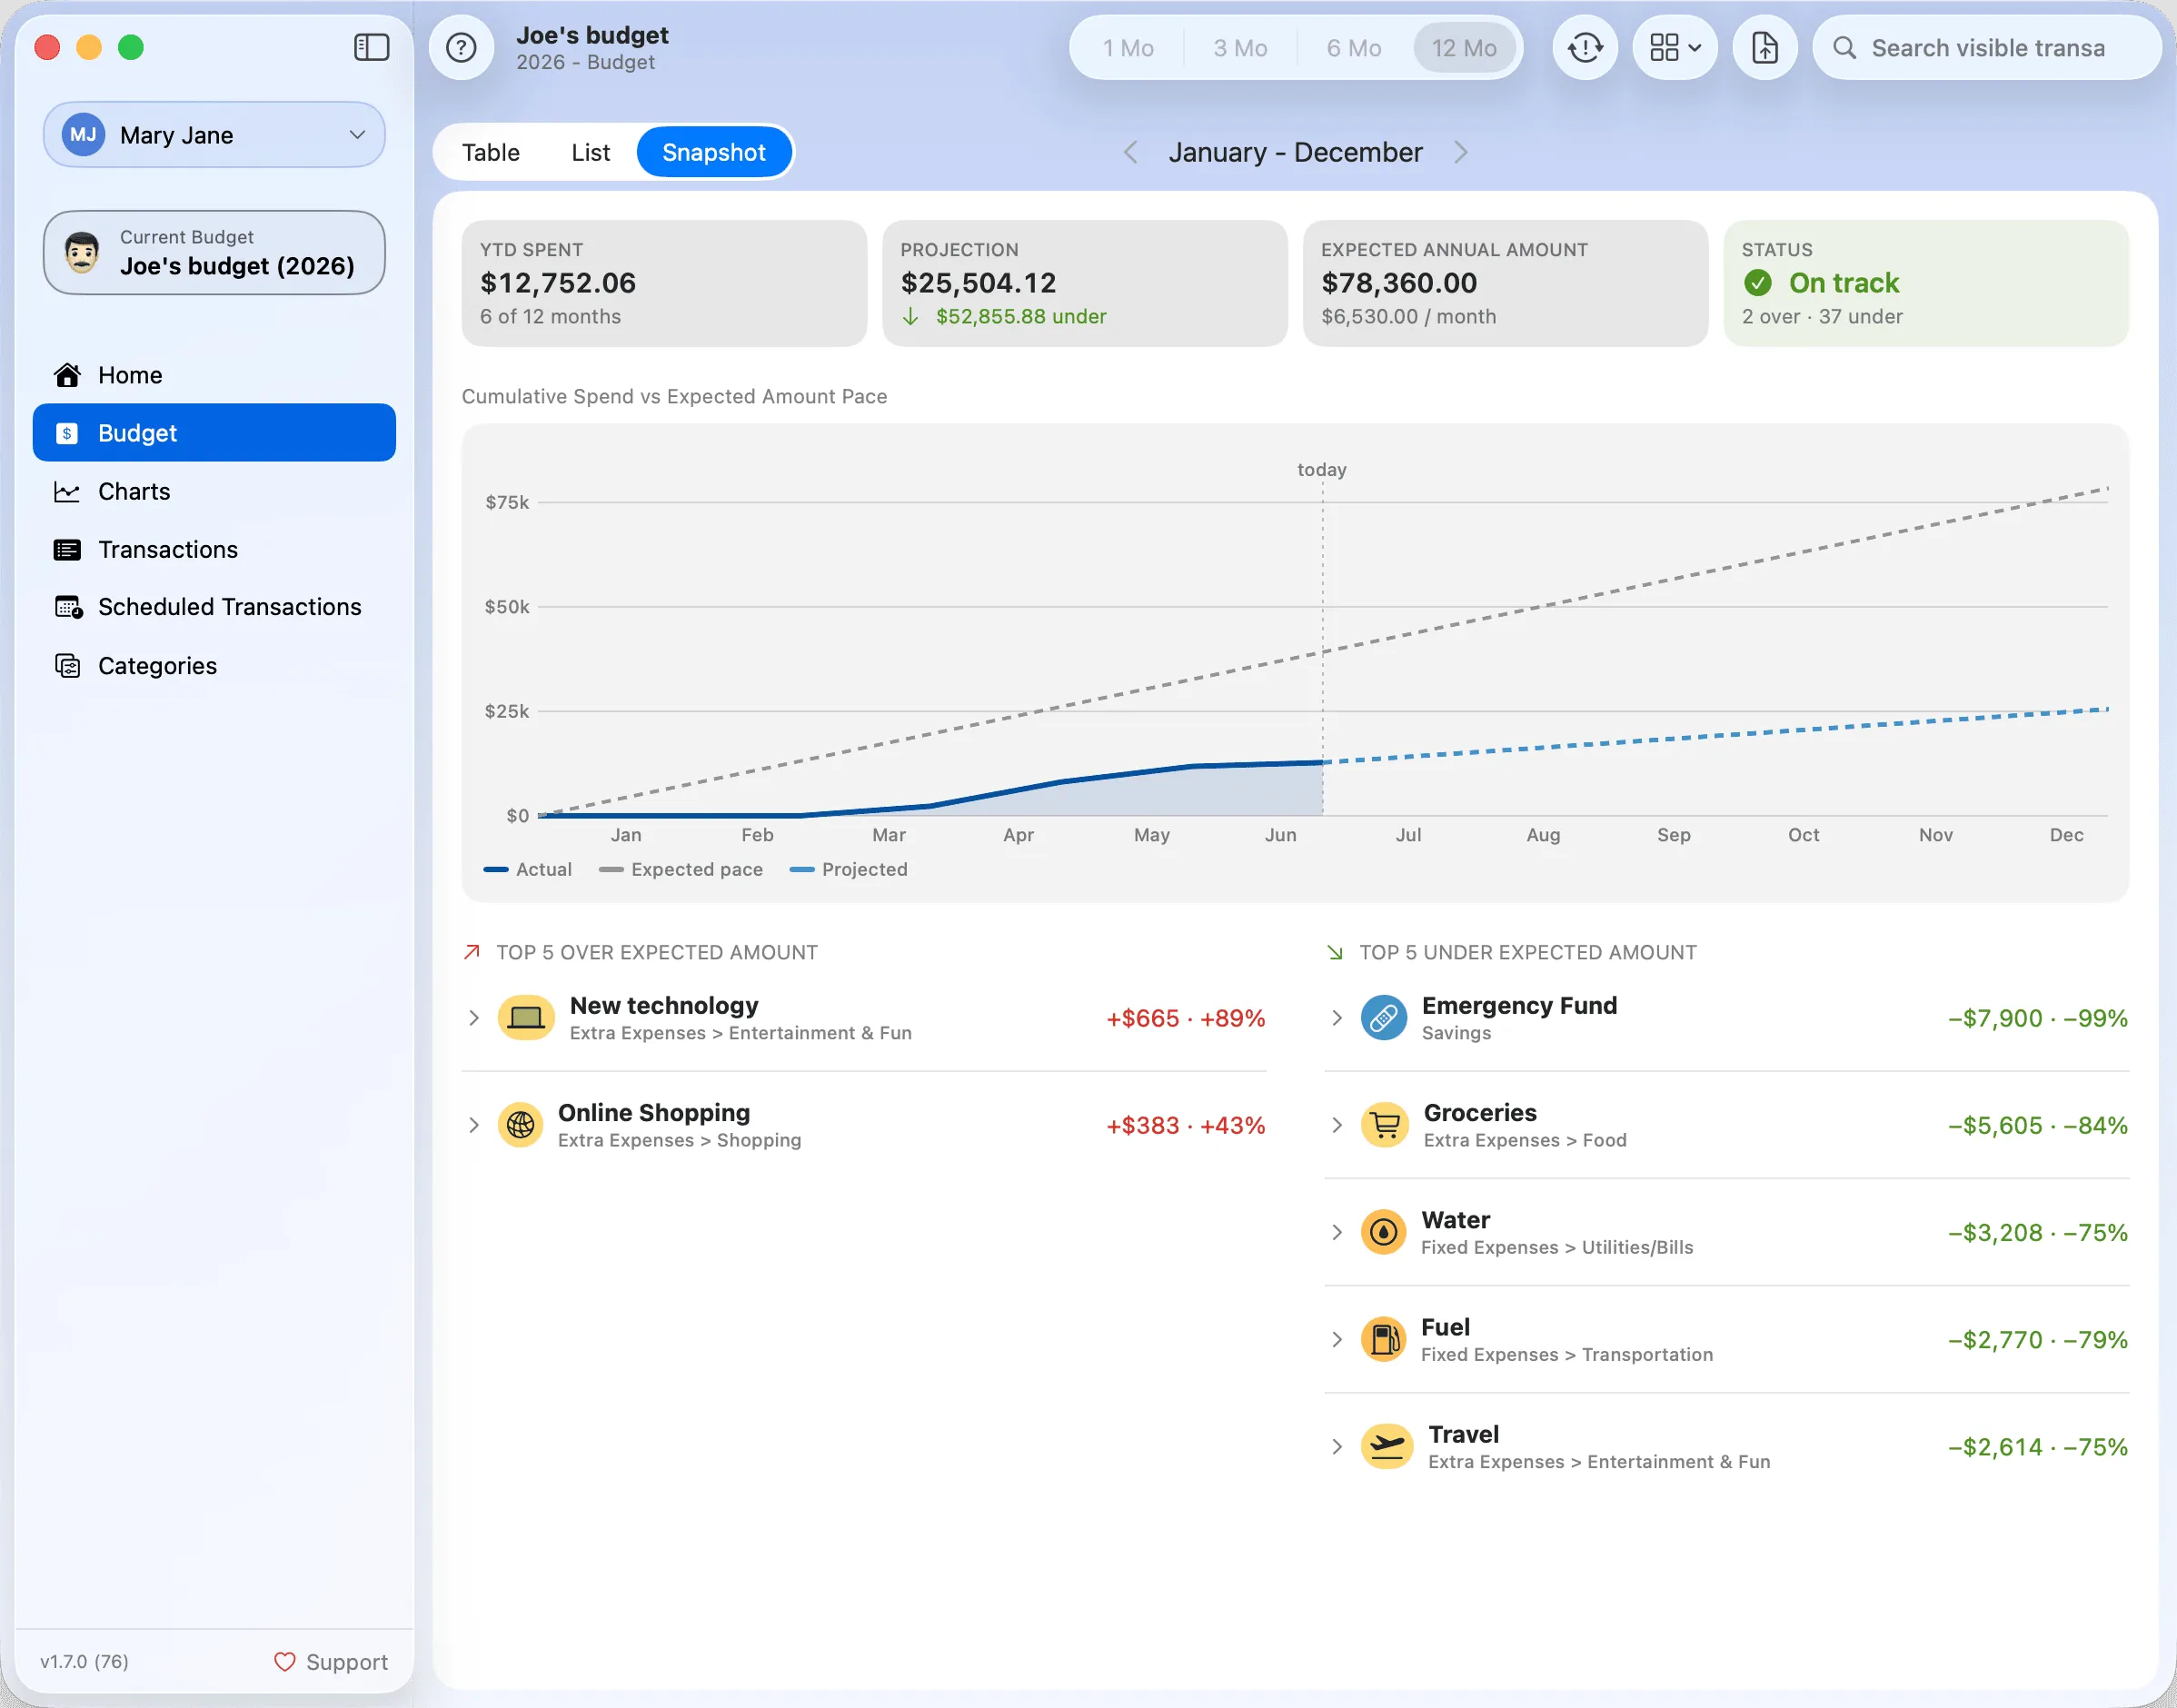
- Snapshot — a whole-budget dashboard for the full year: headline figures (spent, projection, expected), a cumulative spend-vs-expected pace chart, and the Top 5 categories that are most over or under their expected amount. Expand any ranked category to reveal its transactions.
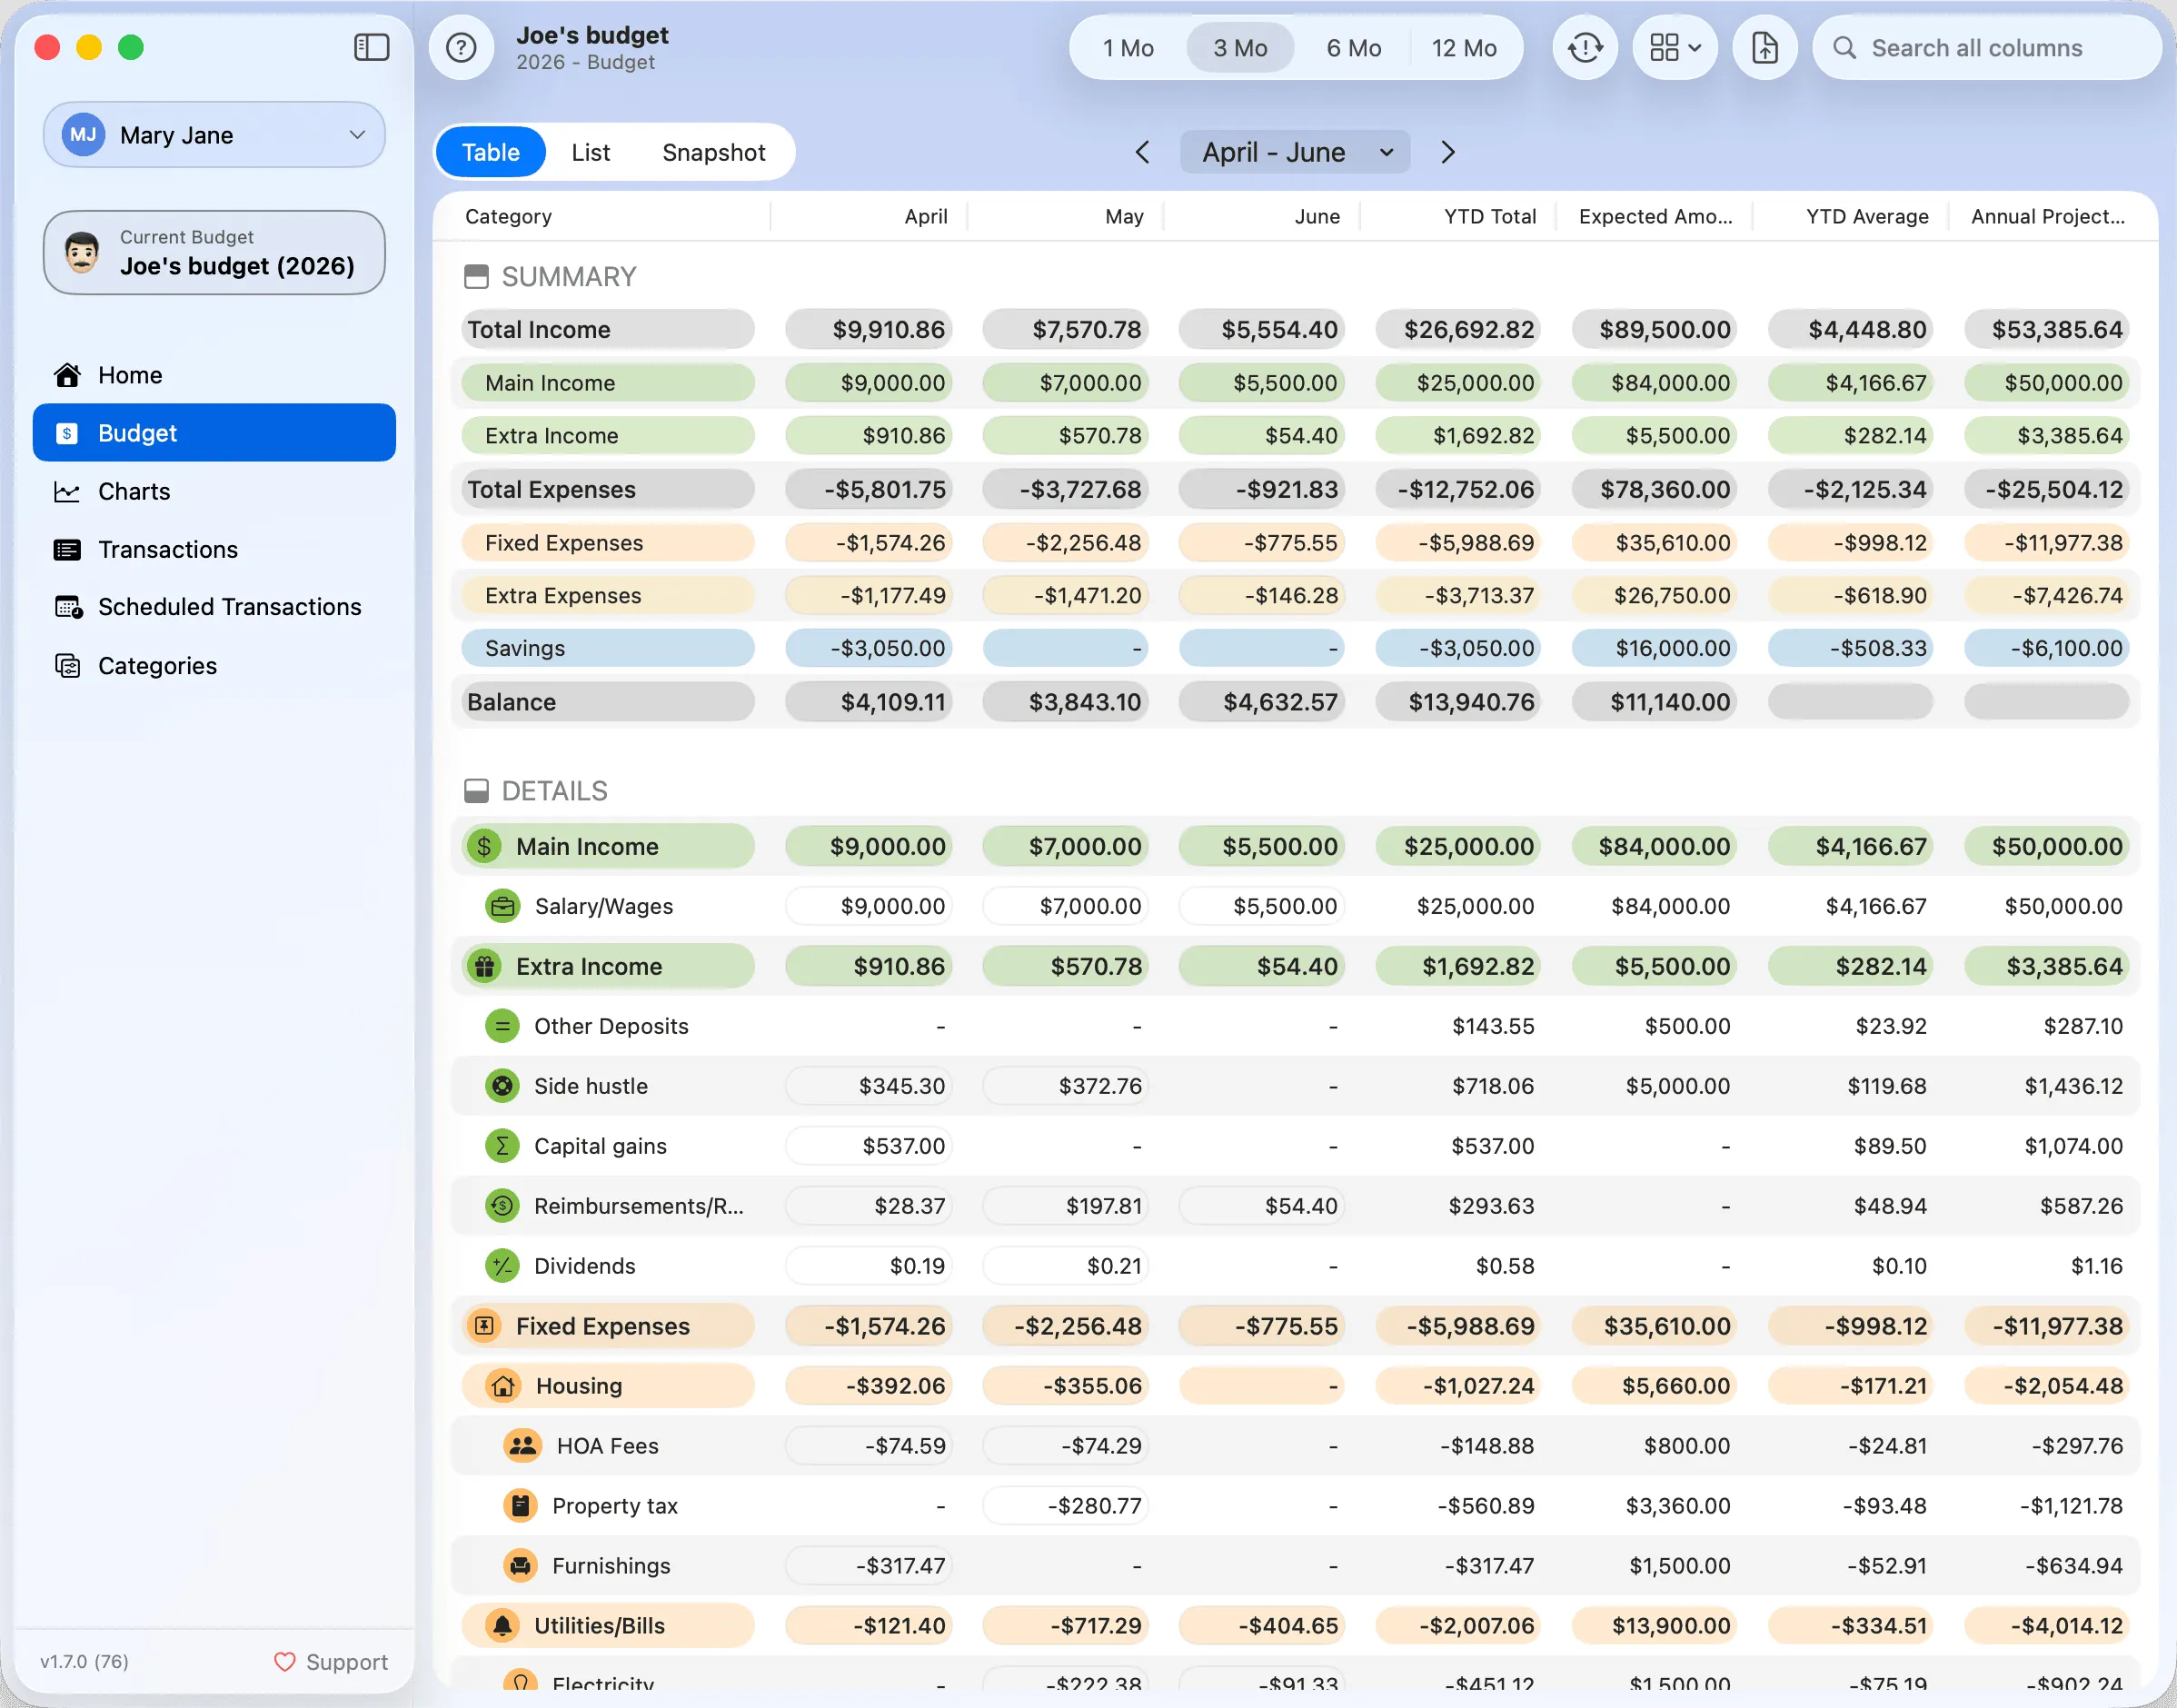
In the Table, each cell represents the total amount for a category in a given month. Hovering over a cell reveals a red border — click it to see a detailed list of transactions that contribute to that total.
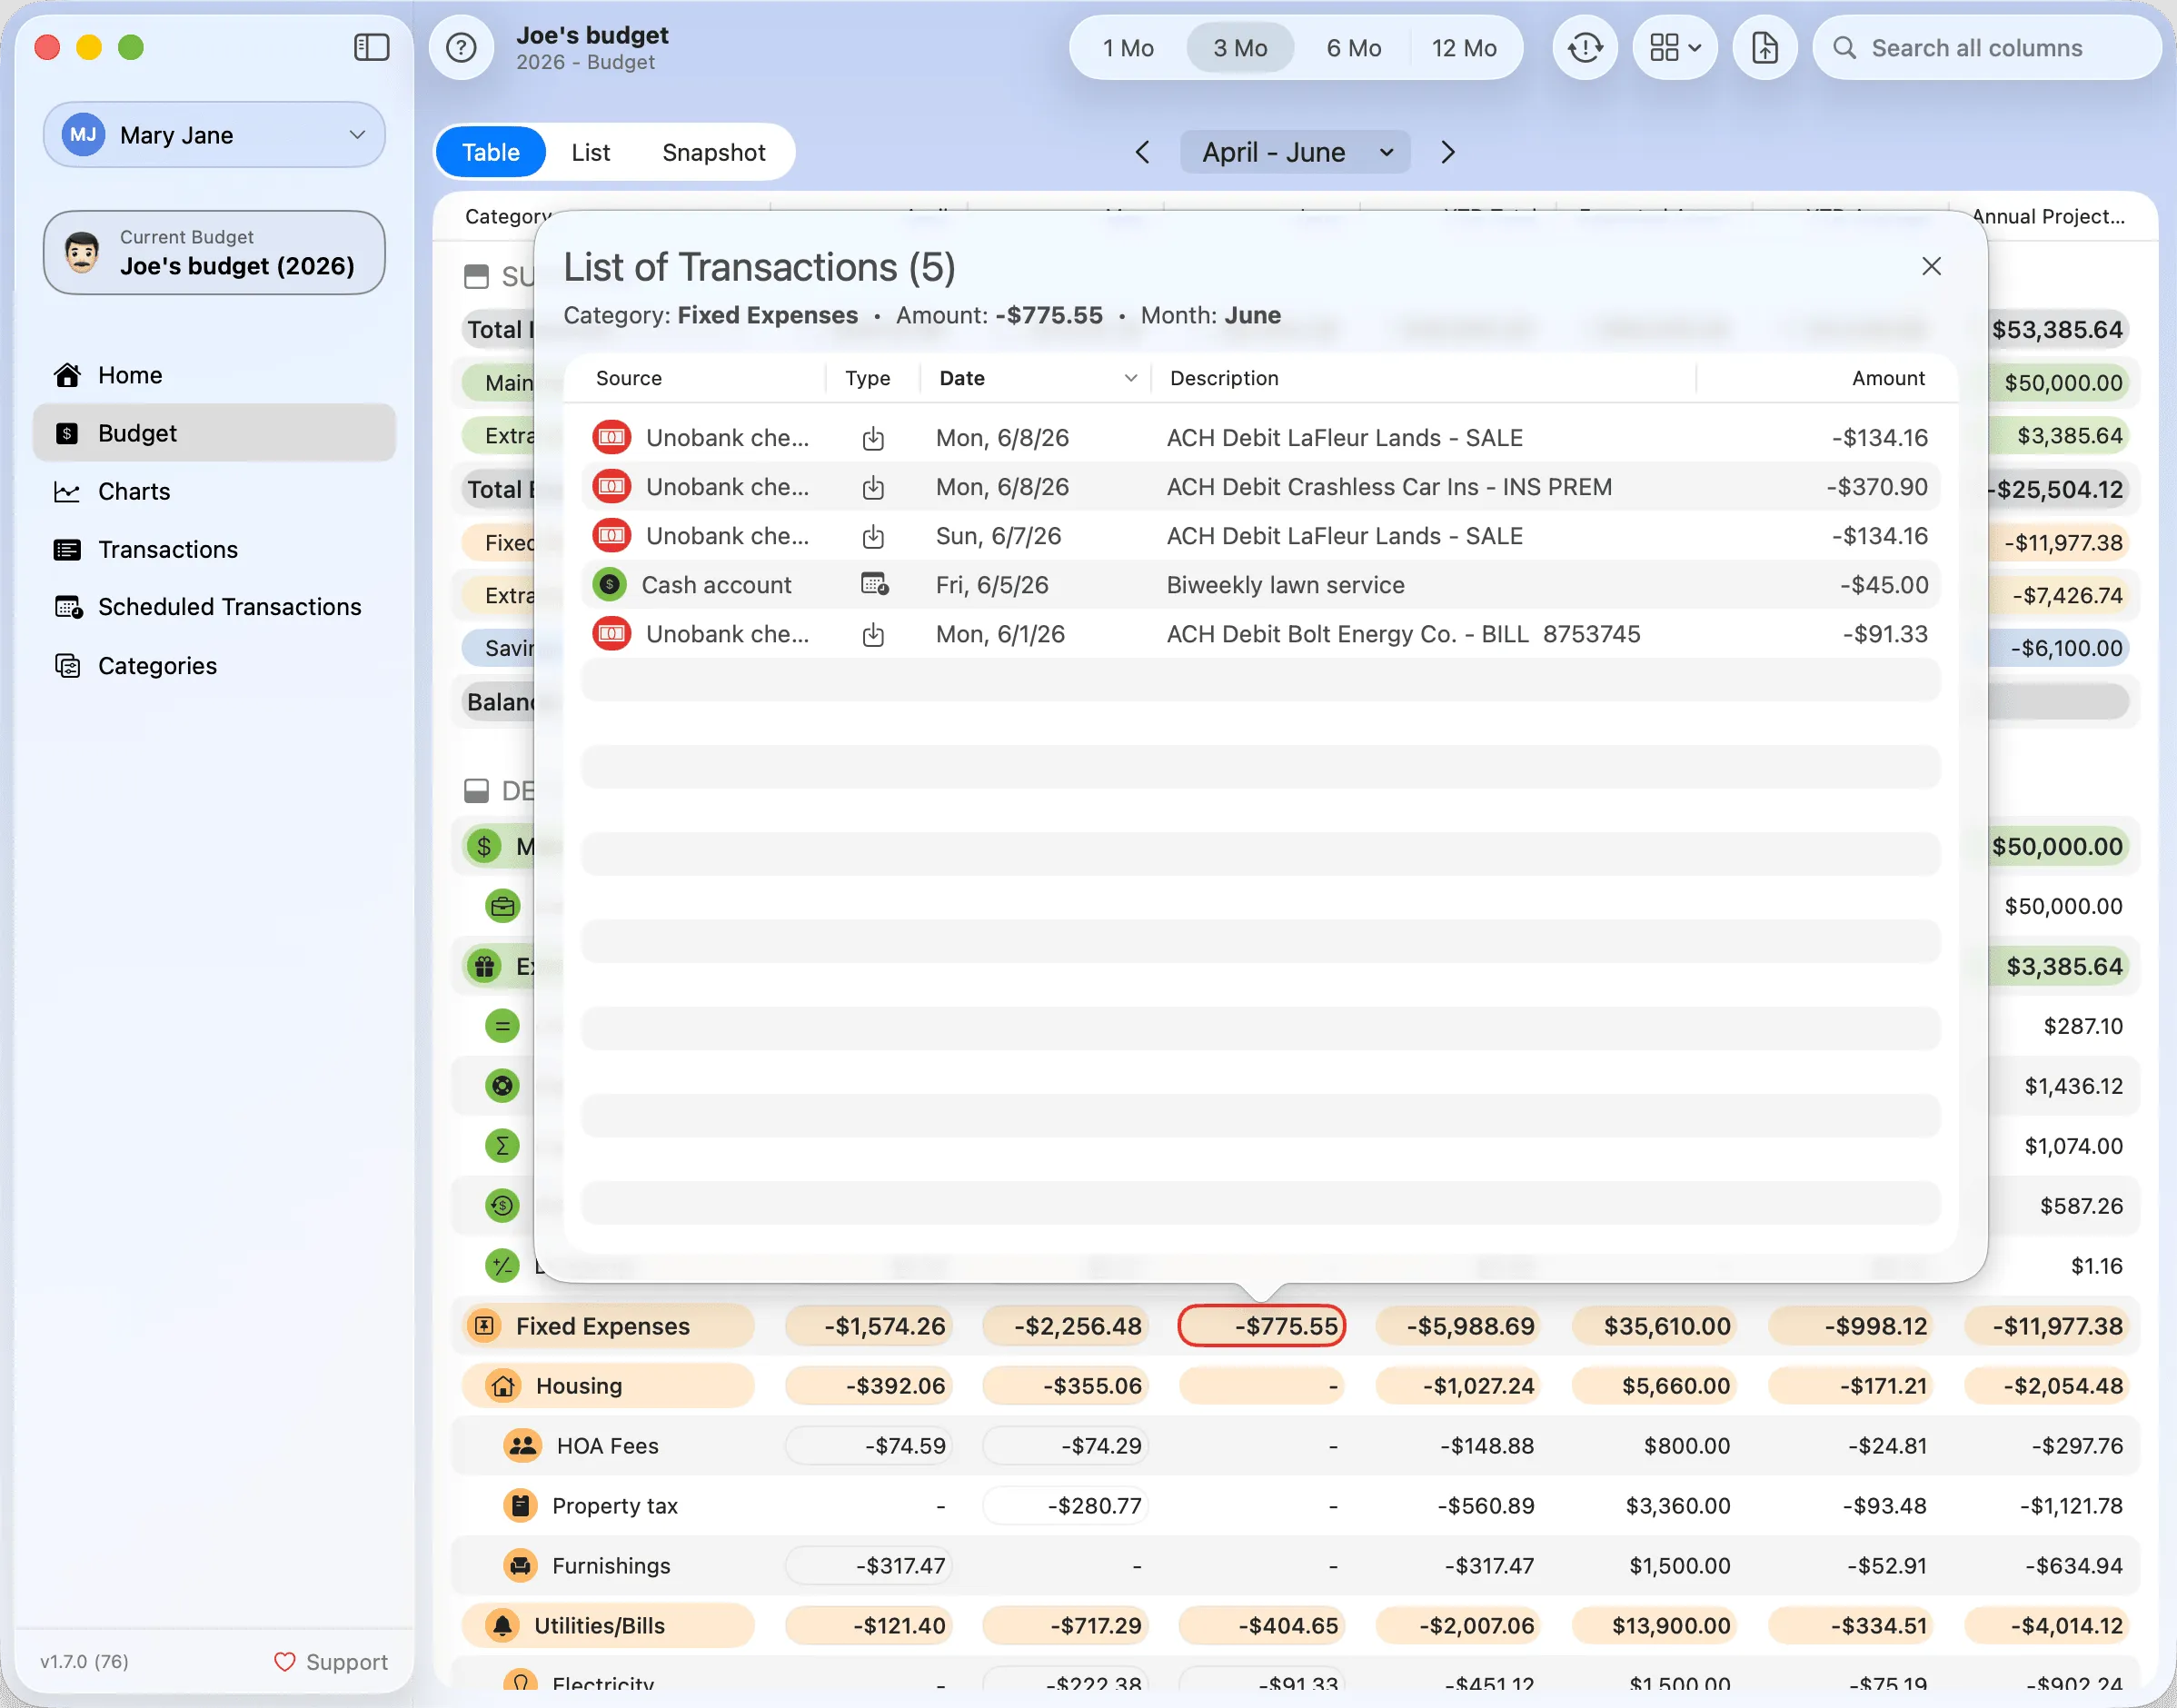
Click any column header in the transactions list to sort by that column; click again to reverse the order. The sort order isn't saved between launches — the table always opens with its default sort.
Toolbar

The toolbar provides quick access to essential controls for analyzing, filtering, and managing your budget.
Period Selection (1 Month, 3 Months, 6 Months, and 12 Months)
Use the period selector to change how many months are in view. The Table shows that many month columns; the List aggregates each category over that timeframe. The Table and List each remember their own period — you can keep the Table at 12 months while the List stays at 3. The Snapshot is always a full year, so the period control is disabled while it's shown.
Budget Recalculation
This button recalculates your budget based on the latest available transactions. It’s especially useful after importing data or modifying categories. Depending on your preferences (see Settings), this may also happen automatically.
If you prefer full manual control, auto-recalculation can be disabled so you can trigger it only when needed.
This button is hidden when an archived budget is selected. See Archived Budgets for details.
View Options
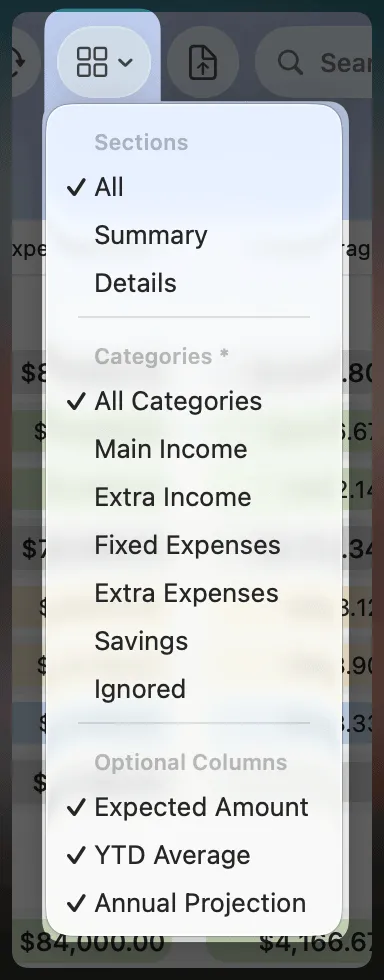
The view menu lets you further customize the display. Which options apply depends on the current view:
- Sections (Table only): Show All, Summary, or Details sections.
- Categories: Filter by a top-level category. In the Table this narrows the rows; in the List it narrows the tree to that category's branch. (Not available in the Snapshot.)
- Optional Columns (Table only): Show or hide the Expected Amount column (your yearly expected amount for each category — a fixed budget or an adjustable forecast), the YTD Average and the Annual Projection (YTD Average × 12) columns.
Options that don't apply to the current view appear disabled.
Export to CSV
This button allows the current budget to be exported to a local file in CSV (Comma-Separated Values) format.
Search
The search field instantly filters what's shown, and adapts to the current view. In the Table it matches every column — category names and the amounts in any visible column. In the List it matches category names and the amounts the List shows (the period Amount and YTD average). In the Snapshot it filters the transactions under any expanded category. Matching is flexible — for amounts you can type just the digits, no formatting needed.