Getting Started
Introduction
New to BUDGIX? Watch a 5-min getting started walkthrough to see the app in action.
BUDGIX helps you manage your budget and track your expenses easily and efficiently. You can create custom categories, set monthly targets, view reports and charts, and export your data to CSV files if needed. To get started and become more familiar with the app, follow the First Steps section.
Help is always a click away
Wherever you are in the application, the toolbar at the top will always display these 3 components:
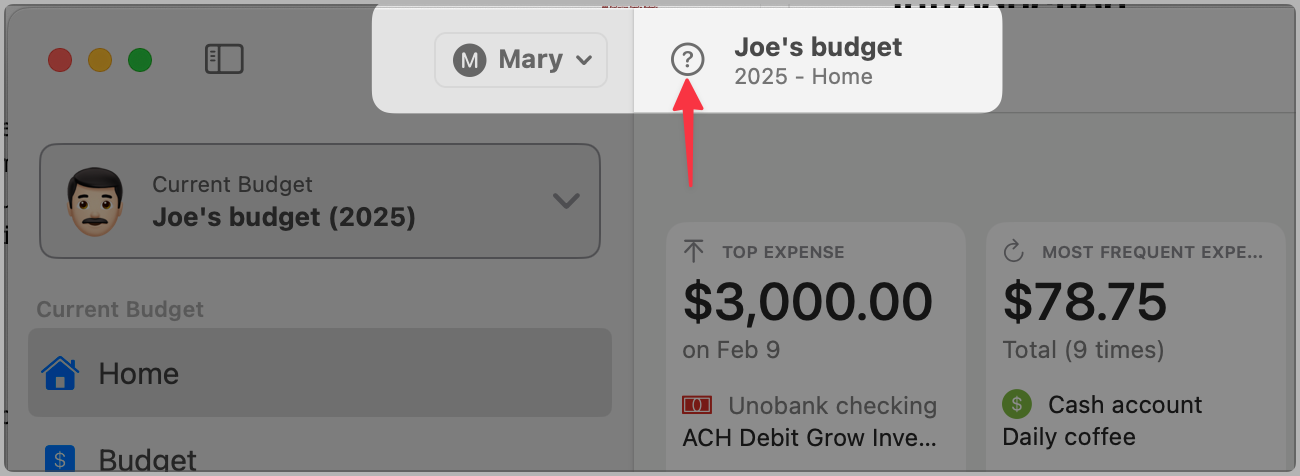
- The first is the Profile dropdown menu where you will find core functions like Manage Profile, Budgets, Accounts, Budget Goals, and Settings.
- The second is the context-sensitive help button, highlighted by a red arrow, which opens the help page of the screen you're on, in your default browser.
- The third is the name and year of the selected budget, along with the navigation section you’re currently viewing.
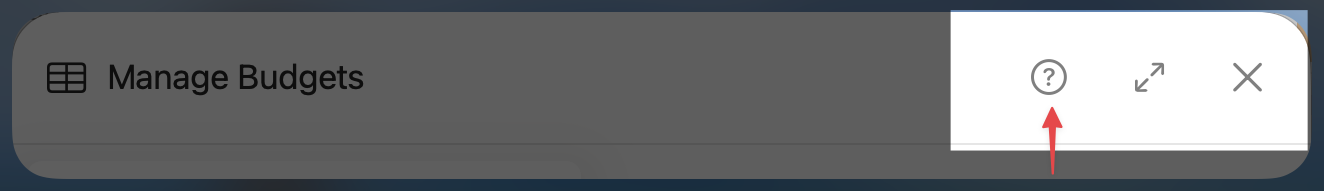
If you are in a sheet, such as Manage Budgets or any other, you will find the help button in the header followed by the resize and close buttons, as shown in the image below. The resize button maximizes the sheet dimensions, giving you more space to work, but it is limited to the app window size.
Resize Behavior: All sheets support resizing and will remember their last resized dimensions across sessions. However, if the application window has been reduced in size since the sheet was last resized, and the saved dimensions would exceed the current window size, the sheet will automatically revert to its original default size instead of forcing the window to temporarily resize to accommodate it. The resize state is also reset, so you can click the resize button again to expand the sheet to fit the current window dimensions.
First Steps
This guide will help you understand why these sample budgets were created and get you familiar with several features by exploring different scenarios.
Exploring Sample Budgets
To begin exploring the sample budgets, let’s learn more about the characters Joe and Susan. Understanding their (fictitious) life choices and how they use the app will help you better interpret the sample data.
Joe and Susan Characters
Joe works full-time as a graphic designer and also takes freelance projects. He travels frequently for work, visiting different cities and dealing with various businesses. He prefers downloading transactions from his bank and credit card providers instead of entering them manually. Joe also attends art fairs and conferences. He uses the 50/30/20 budgeting system — 50% for needs, 30% for wants, and 20% for savings. He tracks individual categories and adjusts his forecast values throughout the year.
Susan works as an administrative assistant and lives on a tight budget. She rents an apartment but owns a vacation home where she enjoys her time off. She lives simply, avoids unnecessary luxuries, and is very organized with her finances. She enters all her transactions manually and keeps her categories minimal. She follows an 80/20 rule, spending 80% of her income and saving 20% for emergencies and investments. Susan tracks her budget at the category level and monitors her target percentages closely.
About the Sample Budgets
The data for both budgets is created when you first install the app. Some items like accounts, Budget Goals, and categories are static — even if you reset the sample budgets (see Settings), they remain the same. However, transactions are randomly generated and spread across the last 90 days to simulate some realistic content. So results will vary each time, just like they would with your own data.
Walkthrough
Click on each navigation section listed below, then look at the application and read the comments to understand what to observe. Repeat the steps for both Joe and Susan to compare their approaches.
Home (Dashboard): The time period defaults to Yearly. Click on This Month and observe the changes. Some widgets will show more data, and the Transactions Timeline chart will span 30 days. Try Weekly and navigate using the arrows ("<" and ">") to the last week. Notice how some widgets show messages when there's no data. The YTD (Year-To-Date) charts also update dynamically. If you can go back far enough, you'll see empty widgets due to the 90-day limit.
Budget: View the consolidated budget in 3- or 6-month intervals. Hover over the icons to see their tooltips. The first icon recalculates the budget manually (though it can also happen automatically). The second icon opens the view options menu. You can configure recalculation and other behavior in Settings.
Charts: Explore the available charts, but don't worry too much about understanding the data just yet. Focus on how you can customize the charts and include or exclude categories from the data.
Transactions: This is where you'll spend the most time. Hover over toolbar buttons to learn their functions. Try selecting a transaction and clicking Edit. Open the Assign Transactions window — you’ll notice some uncategorized transactions. Experiment with filters and sorting. Type in the search field to see how the list updates instantly. Click Add to open the manual transaction entry form, then click Cancel to close it. Lastly, inspect the Type column — hover over icons to see what they represent. Double-click transactions to see their details.
Scheduled Transactions: This screen has two panels — the top lists scheduled items, and the bottom shows generated transactions for the selected one in the top panel. Hover over toolbar icons to learn their functions. Try editing, changing the order, adding new ones, and searching. Double-click a scheduled transaction to view or modify it. You can generate future transactions based on recurrence settings. Once generated, they behave like manual entries.
Note: If there's only one scheduled transaction and it's not selected, click away and click back on it to activate the detail view.
Categories: Categories are how you group and analyze your income and spending. They can have nested levels (though more than three is often unnecessary). Hover over toolbar icons to see what they do. You can edit categories, move transactions between them, reorganize, and add new ones. Switch between Joe’s and Susan’s data to compare. By default, only active categories are shown. Use the view menu to select View All and see hundreds of predefined categories. Activate or rename them and use keywords for automatic categorization.
Taking It for a Spin: Creating Your Own Budget
Ready to try BUDGIX with your own data? The New Budget Assistant makes getting started simple and guides you through the entire process step-by-step.
Quick Start with the Budget Assistant
- Launch the Assistant - Click "New Budget..." from the current budget picker
- Follow the guided steps - The assistant walks you through:
- Setting up your profile (if needed)
- Creating your budget
- Choosing your category setup
- Adding your first account
- Configuring file imports (if using bank files)
- Start using your budget - Once complete, you'll have a fully configured budget ready to use
Two Ways to Track Transactions
Imported Transactions: If your bank provides CSV or OFX/QFX files, the assistant will help you set up automatic importing. Just download a recent file from your bank and the assistant handles the rest.
Manual Entry: Prefer to enter transactions by hand? The assistant can copy categories from our sample budgets to give you a head start, then you can add transactions manually.
What's Next?
After completing the assistant:
- Review your Transactions section and start assigning categories
- Check your Home dashboard to see your budget come to life
- Explore the Charts section for visual insights
- Fine-tune the categories in the Categories section as needed
The assistant eliminates the guesswork and gets you up and running quickly, so you can focus on managing your money instead of configuring the app.
Where to go from here?
Now that you’ve seen how the app can help you organize and track your finances, it’s time to shape it around your personal financial habits.
Begin customizing your Categories to reflect the types of transactions you deal with most—this list forms the foundation for everything from budgeting and forecasting to insightful charts and reports.
Once your categories are in place, you can:
- Enter remaining manual transactions or import them for a full month to quickly see where your money is going.
- Set up Scheduled Transactions for recurring items like rent, salary, or subscriptions if you are using manual transactions.
- Review your Home dashboard to track trends and spot opportunities.
- Use Charts to compare income, spending, and performance against your goals.
And don’t worry—Help is always just a click away!