Totals by Category Group
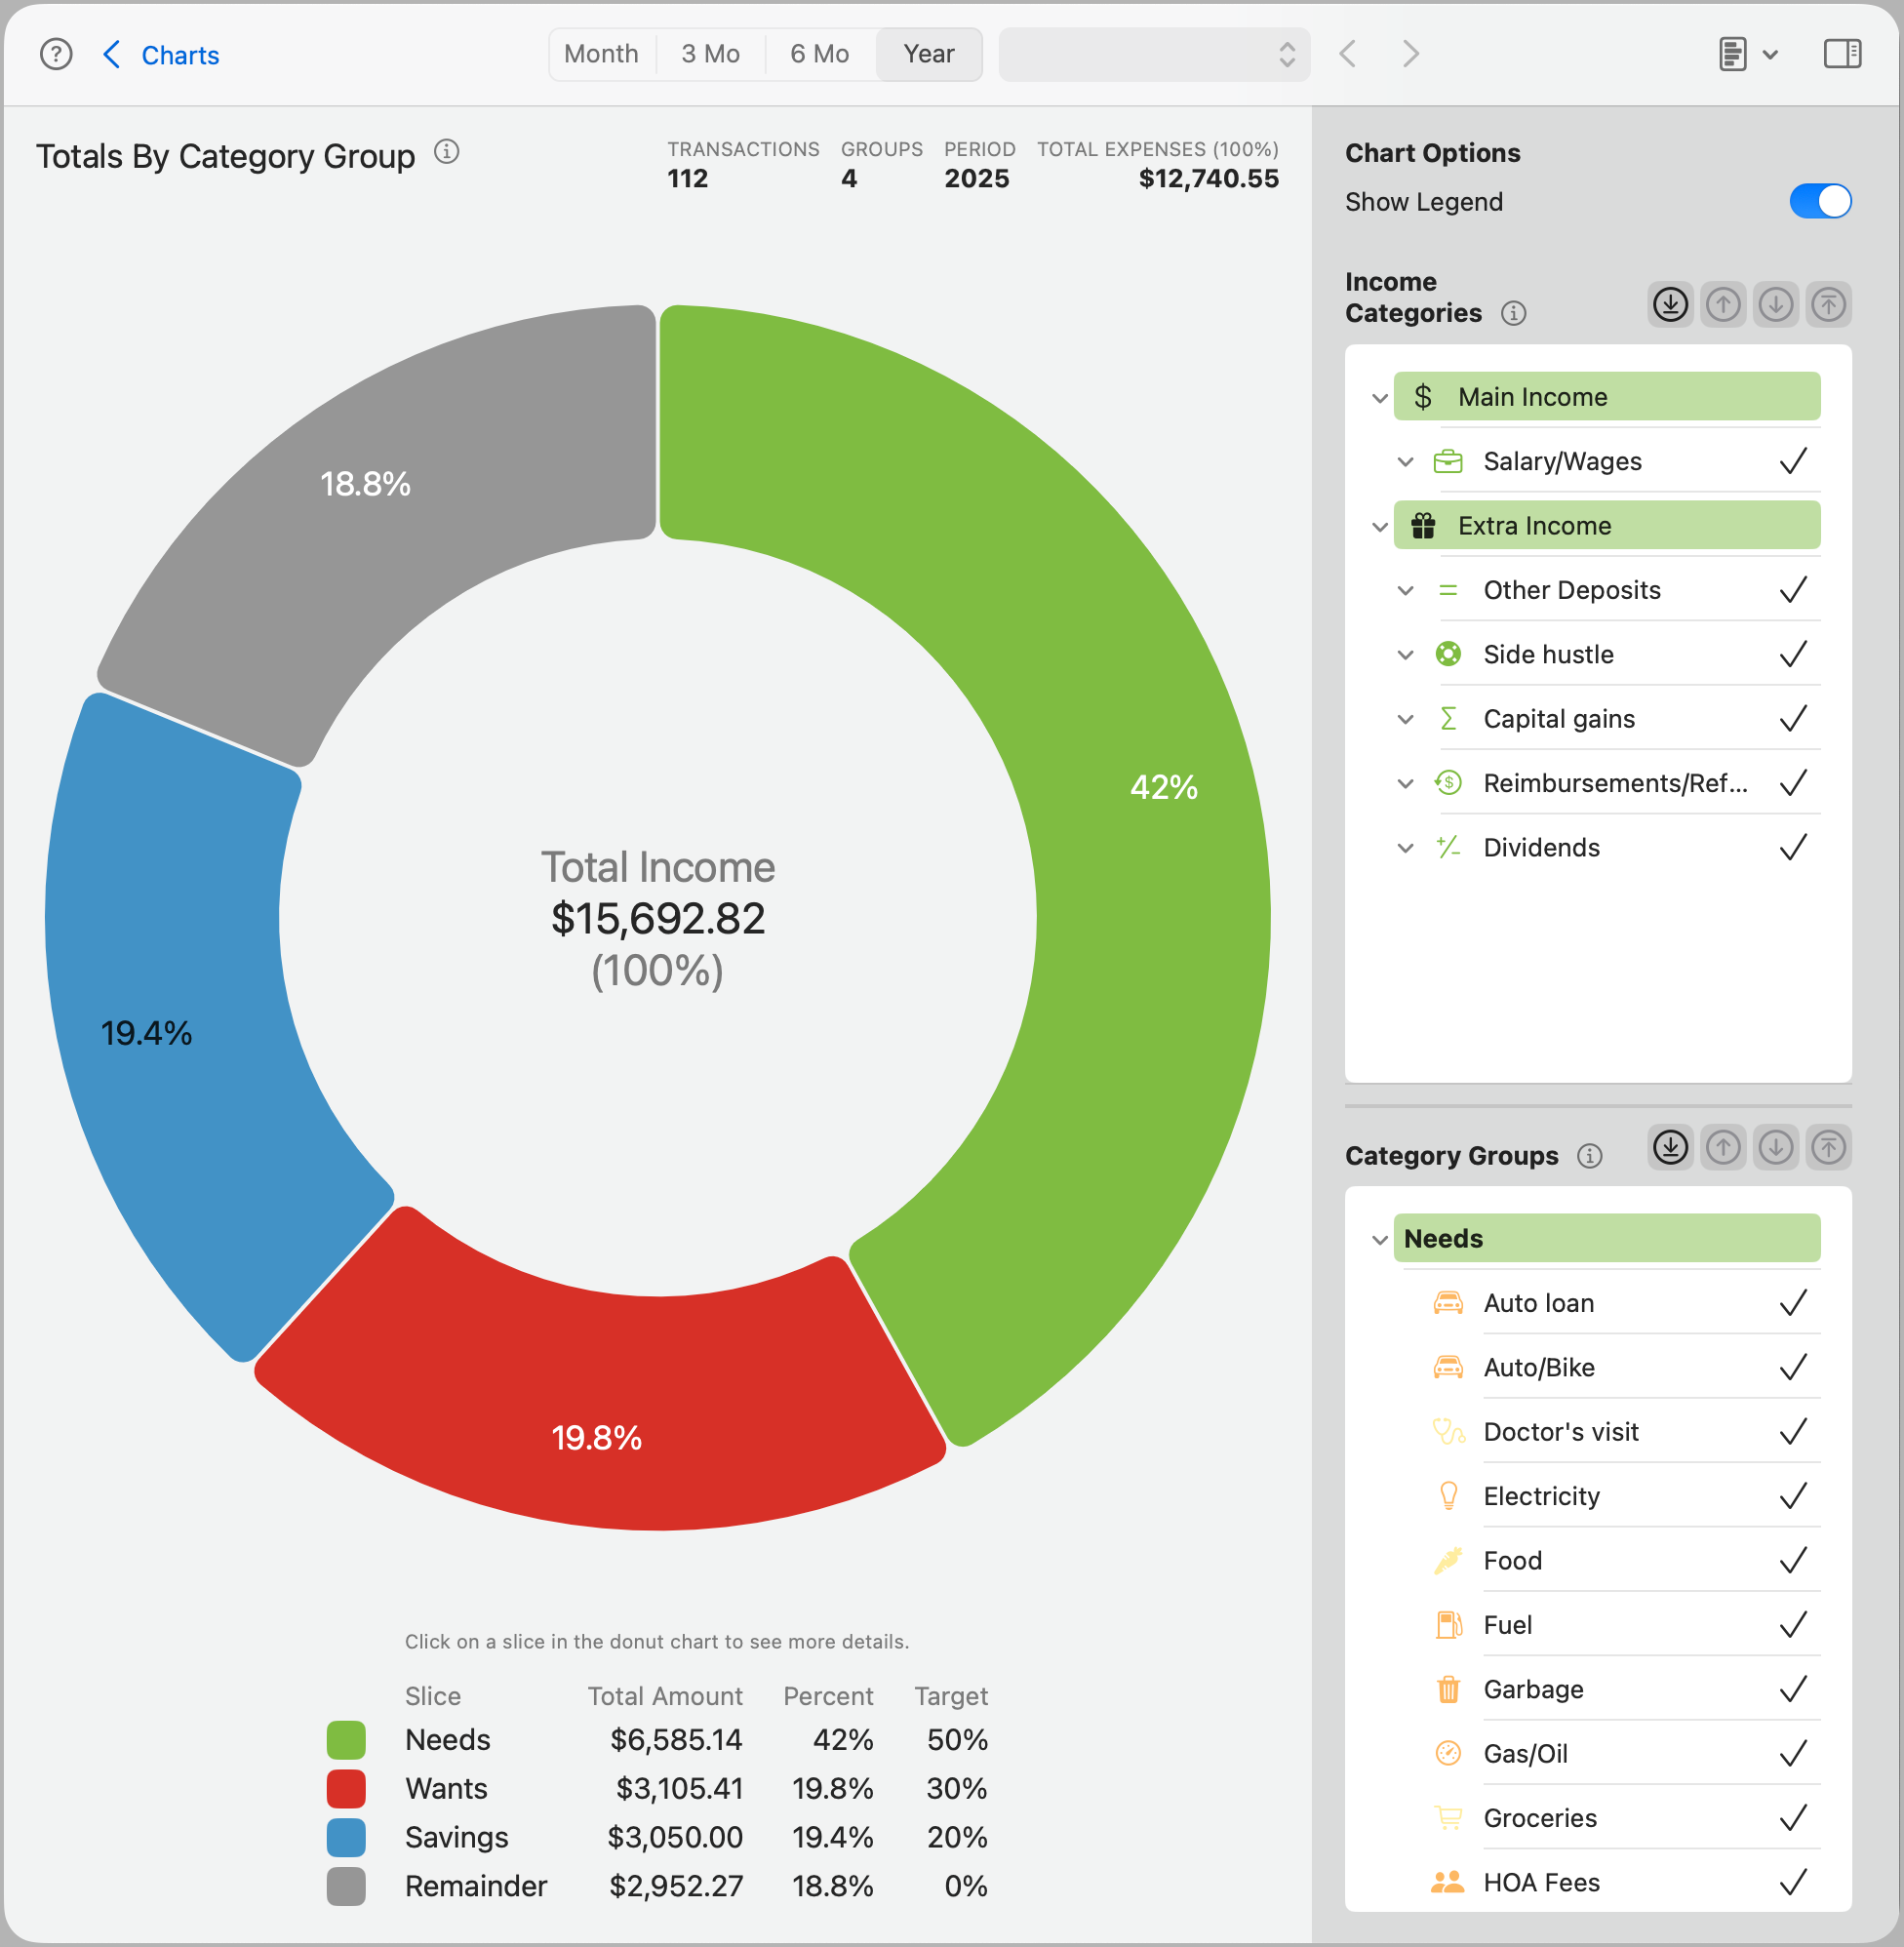
The Totals by Category Group chart gives you a visual breakdown of how your income is distributed across the defined Category Groups—such as Needs, Wants, and Savings. It helps you track how close each group is to its target percentage, offering a quick check of how well your spending aligns with your goals.
Each slice in the donut chart represents one Category Group, showing its total amount and the percentage it represents relative to your income. If a target is defined, it’s displayed alongside the percentage for easy comparison. A gray Remainder slice shows spending not assigned to any group.
Clicking a slice reveals a detailed breakdown of that group, including each contributing category, the total spent, and its share of the group’s total.
Tip: This chart is especially useful when following systems like 50/30/20 or 80/20, helping you understand how closely your spending matches the intended group targets.
Slice Breakdown
Clicking any group slice opens a detail panel that lists all the categories included in that group and their contributions.
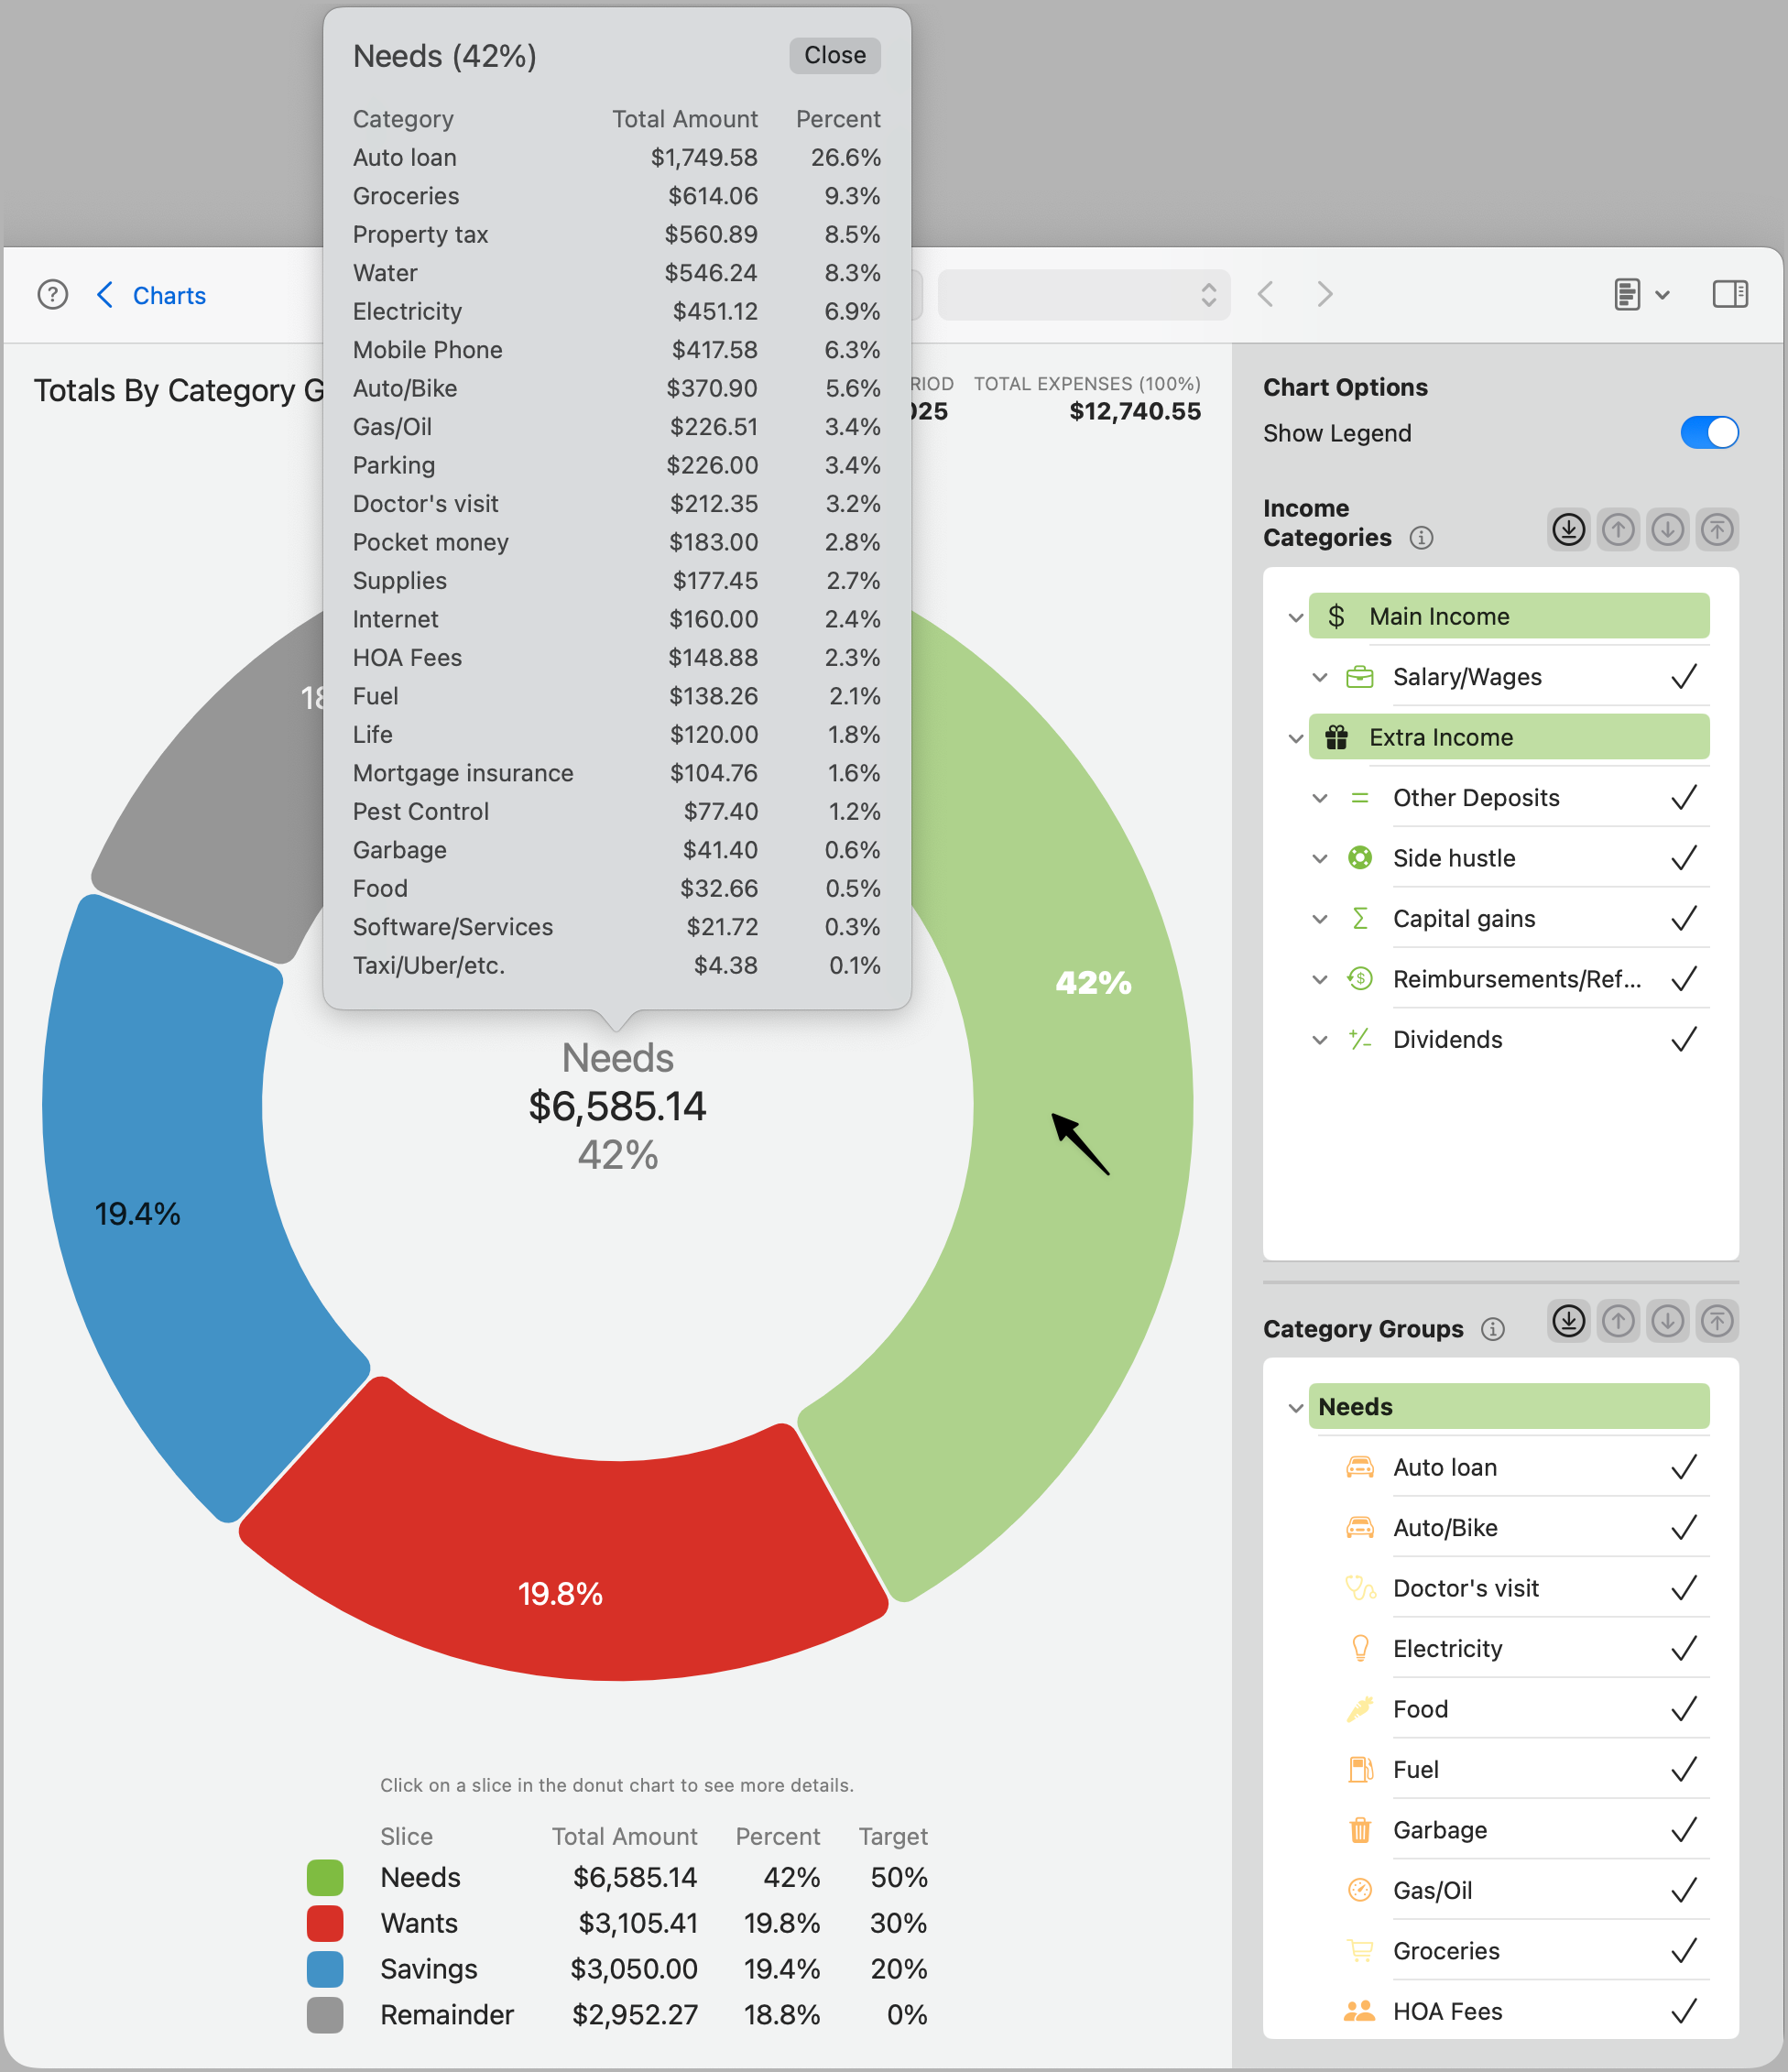
Each entry shows:
- Category Name
- Total Amount
- Percent of Group Total
This lets you quickly identify which categories are driving your spending in each group.
Chart Options
- Show Legend: Toggles the display of the color-coded legend beneath the chart. The legend includes each group’s total amount, actual percentage, and target percentage.
Categories
This chart uses selections from both Income Categories and Category Groups panels to calculate and display the chart data.
Income Categories
Select which income categories should be included in the chart. Only the selected income will be used as the baseline for percentage calculations.
Note: If not enough income or expense data is available due to your selections, the chart will show a warning instead of rendering.
Category Groups
Choose which Category Groups and subcategories to include in the chart. Only categories assigned to a group will be shown.
- Category list: You can include or exclude specific subcategories from a group. The donut chart updates dynamically based on your selection.
- Shortcut buttons:
- Bottom arrow: Selects all subcategories in the list. This is the only active shortcut for this chart. The others are intentionally disabled to keep the interface focused and simple.
All category selections and chart options are saved and automatically restored when you return to this chart.